
Raporty Szkoleniowe PQM
Szkolenie PQM / Reports and KPI Dashboard
Management Insight
Reports and KPI Dashboard
Read production reports, KPI charts, margins, loss tasks and exports using clean task data.
Production OSWordPress CoreRole-based workflowTraining Center
Training pages
Training HomeProduction DashboardCore ConfigurationTasks and Add TaskDepartments and WorkflowCalendar and Standard GanttEmail Queue and CommunicationReports and KPIModules / MarketplaceSetup WizardLicense and Demo ModeHelp and TrainingAdmin PanelClient PanelEmployee Worker PortalShop Manager / SupervisorImplementation Checklist
Purpose in plain language
Reports and KPI screens turn production work into management information. They help answer questions such as: how many tasks were completed, which jobs are late, which departments are overloaded, which orders lost money, and whether production is improving.
For a beginner, reports are not magic. They are calculations based on task data. If statuses, dates, costs or departments are missing, the report may look empty or misleading.
Where to click
Open WordPress admin and choose PQM.
Click Reports, KPI or Analytics.
Choose a report type such as monthly margin, task report, loss tasks, status mix or KPI dashboard.
Set the date range before judging results.
Use filters such as status, department or customer/order when available.
Export CSV/XLS/PDF only after checking that filters and date range are correct.
Main report types explained
| Report / KPI | Question it answers | Data that must be correct |
|---|---|---|
| Task totals | How many tasks exist, are open or were completed? | Status, created date, completed date. |
| Done per day | How much work was completed each day? | Completed status and completion date. |
| Status mix | How is work distributed across statuses? | Current status of each task. |
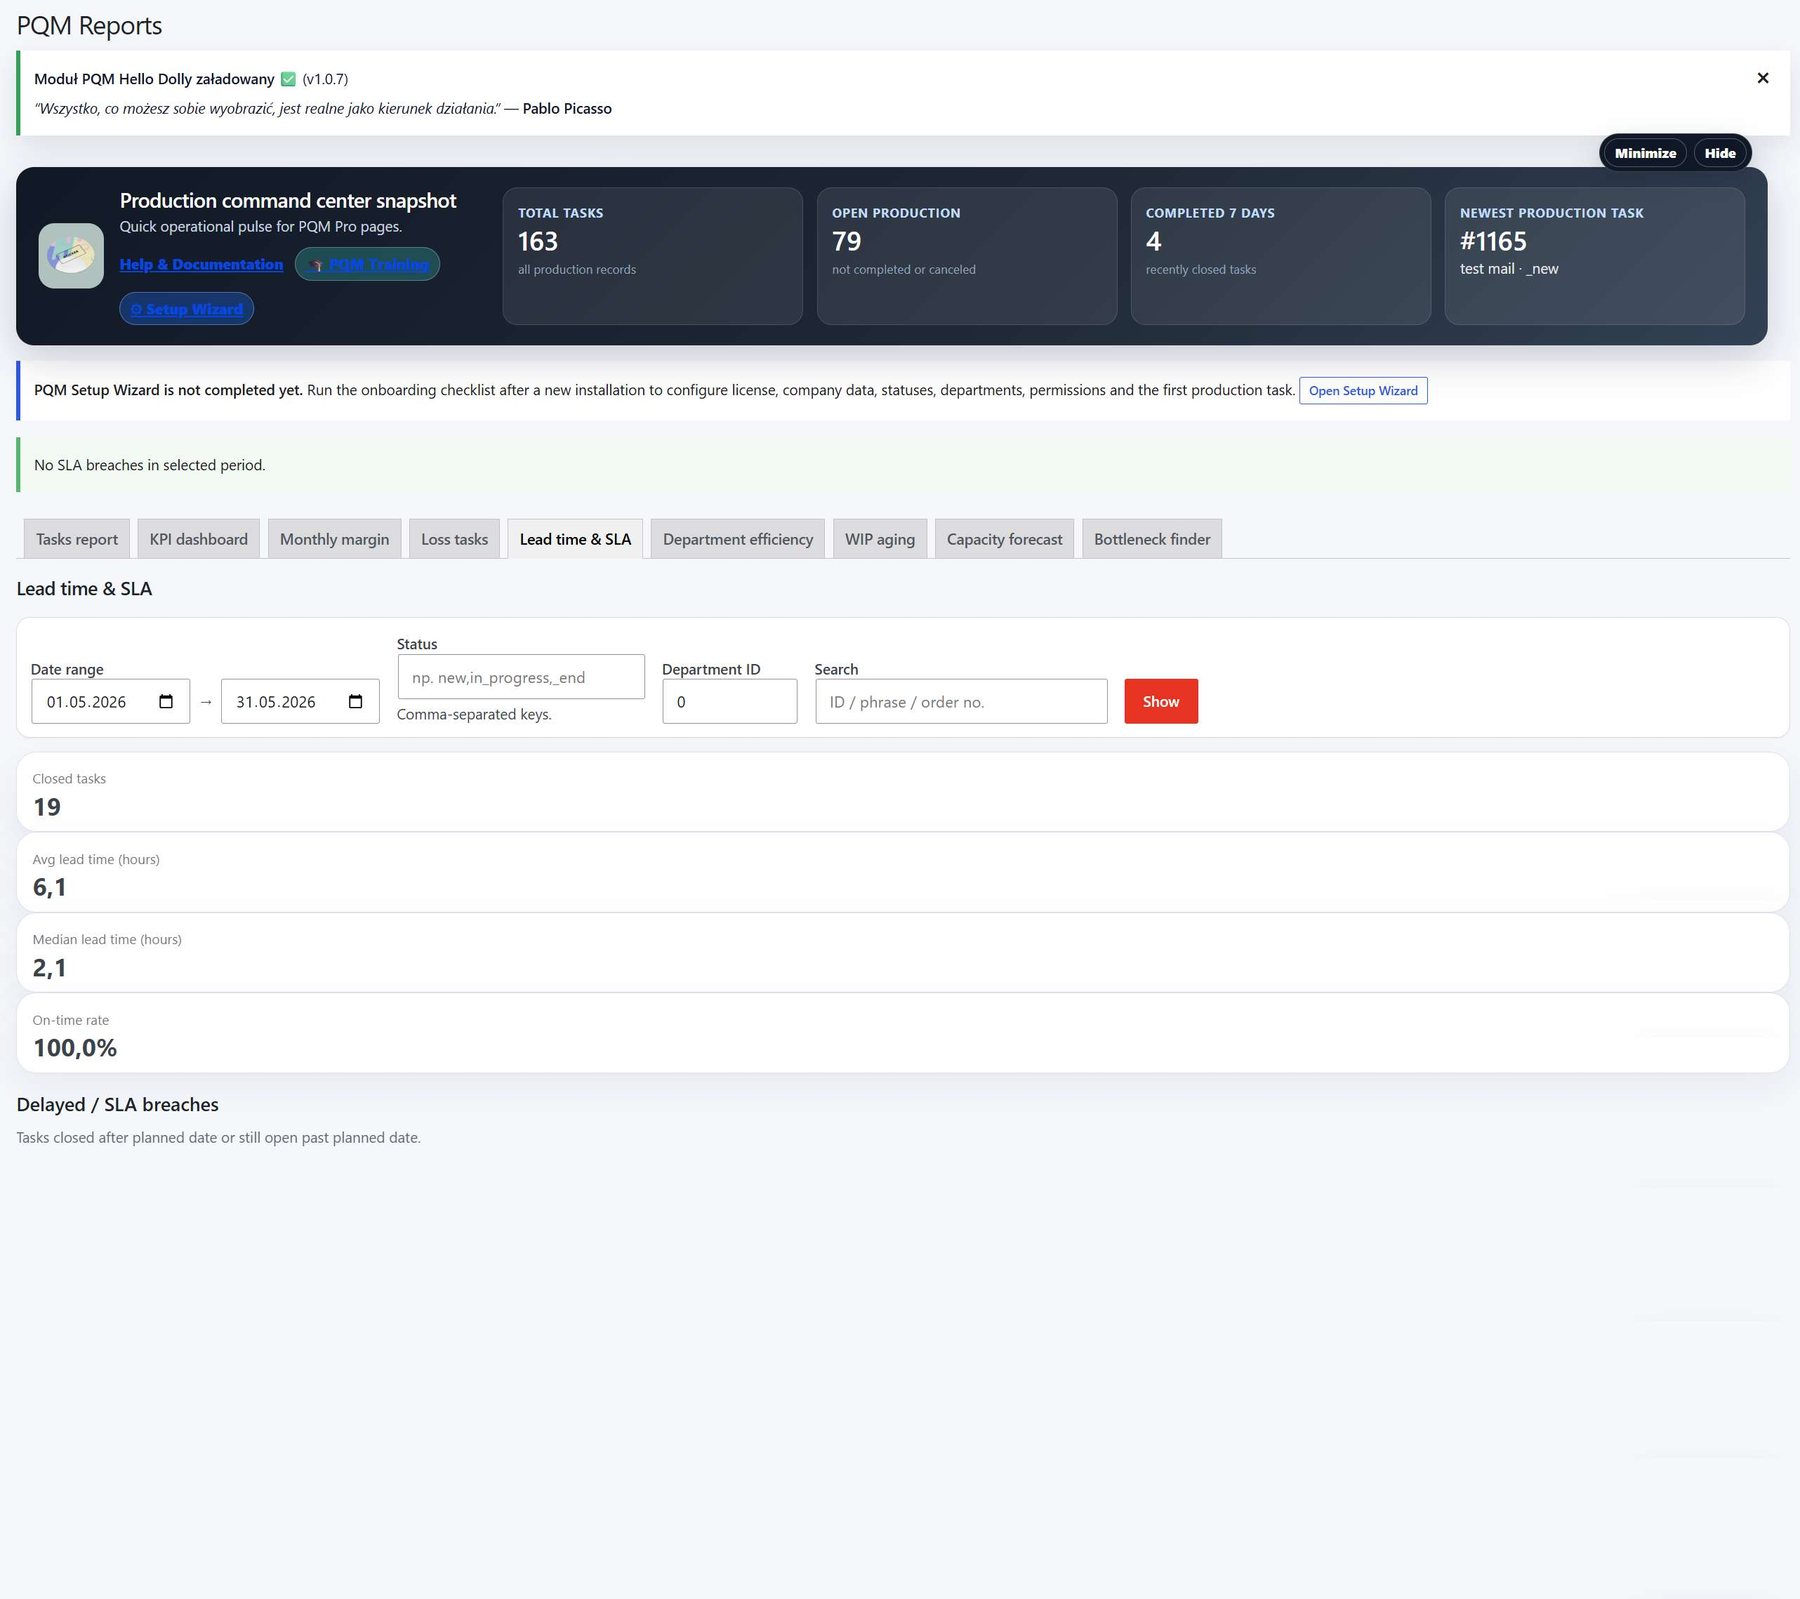
| On-time percentage | What percentage of completed tasks met the deadline? | Deadline, completion date and completed status. |
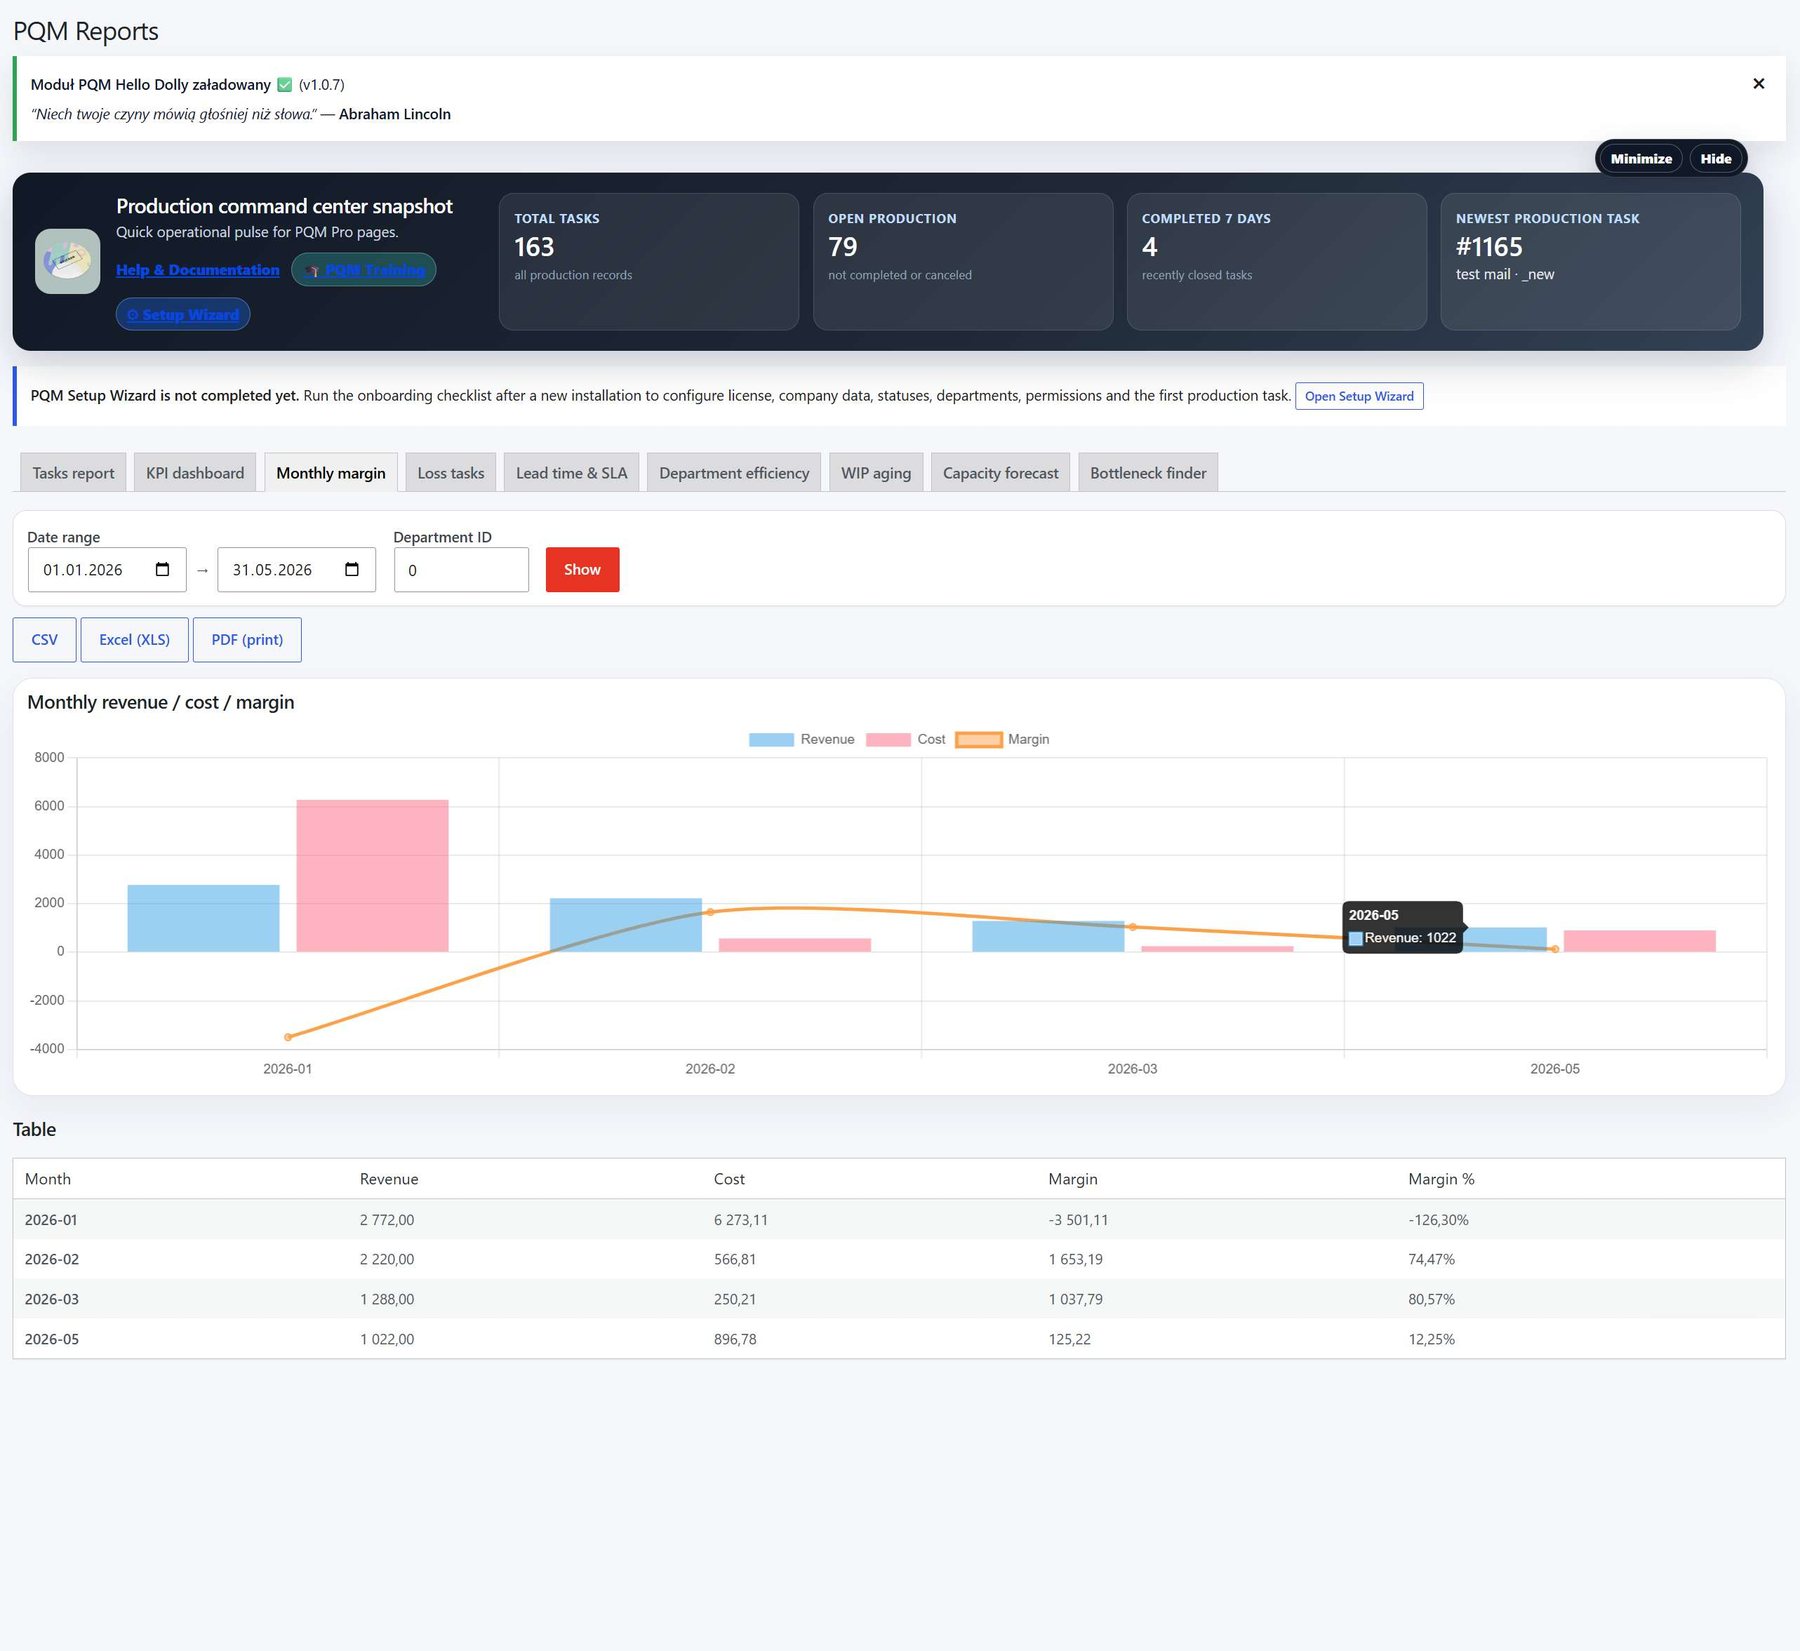
| Monthly margin | Did production earn or lose money in the selected period? | Order revenue, task cost, labor/material values, WooCommerce totals if used. |
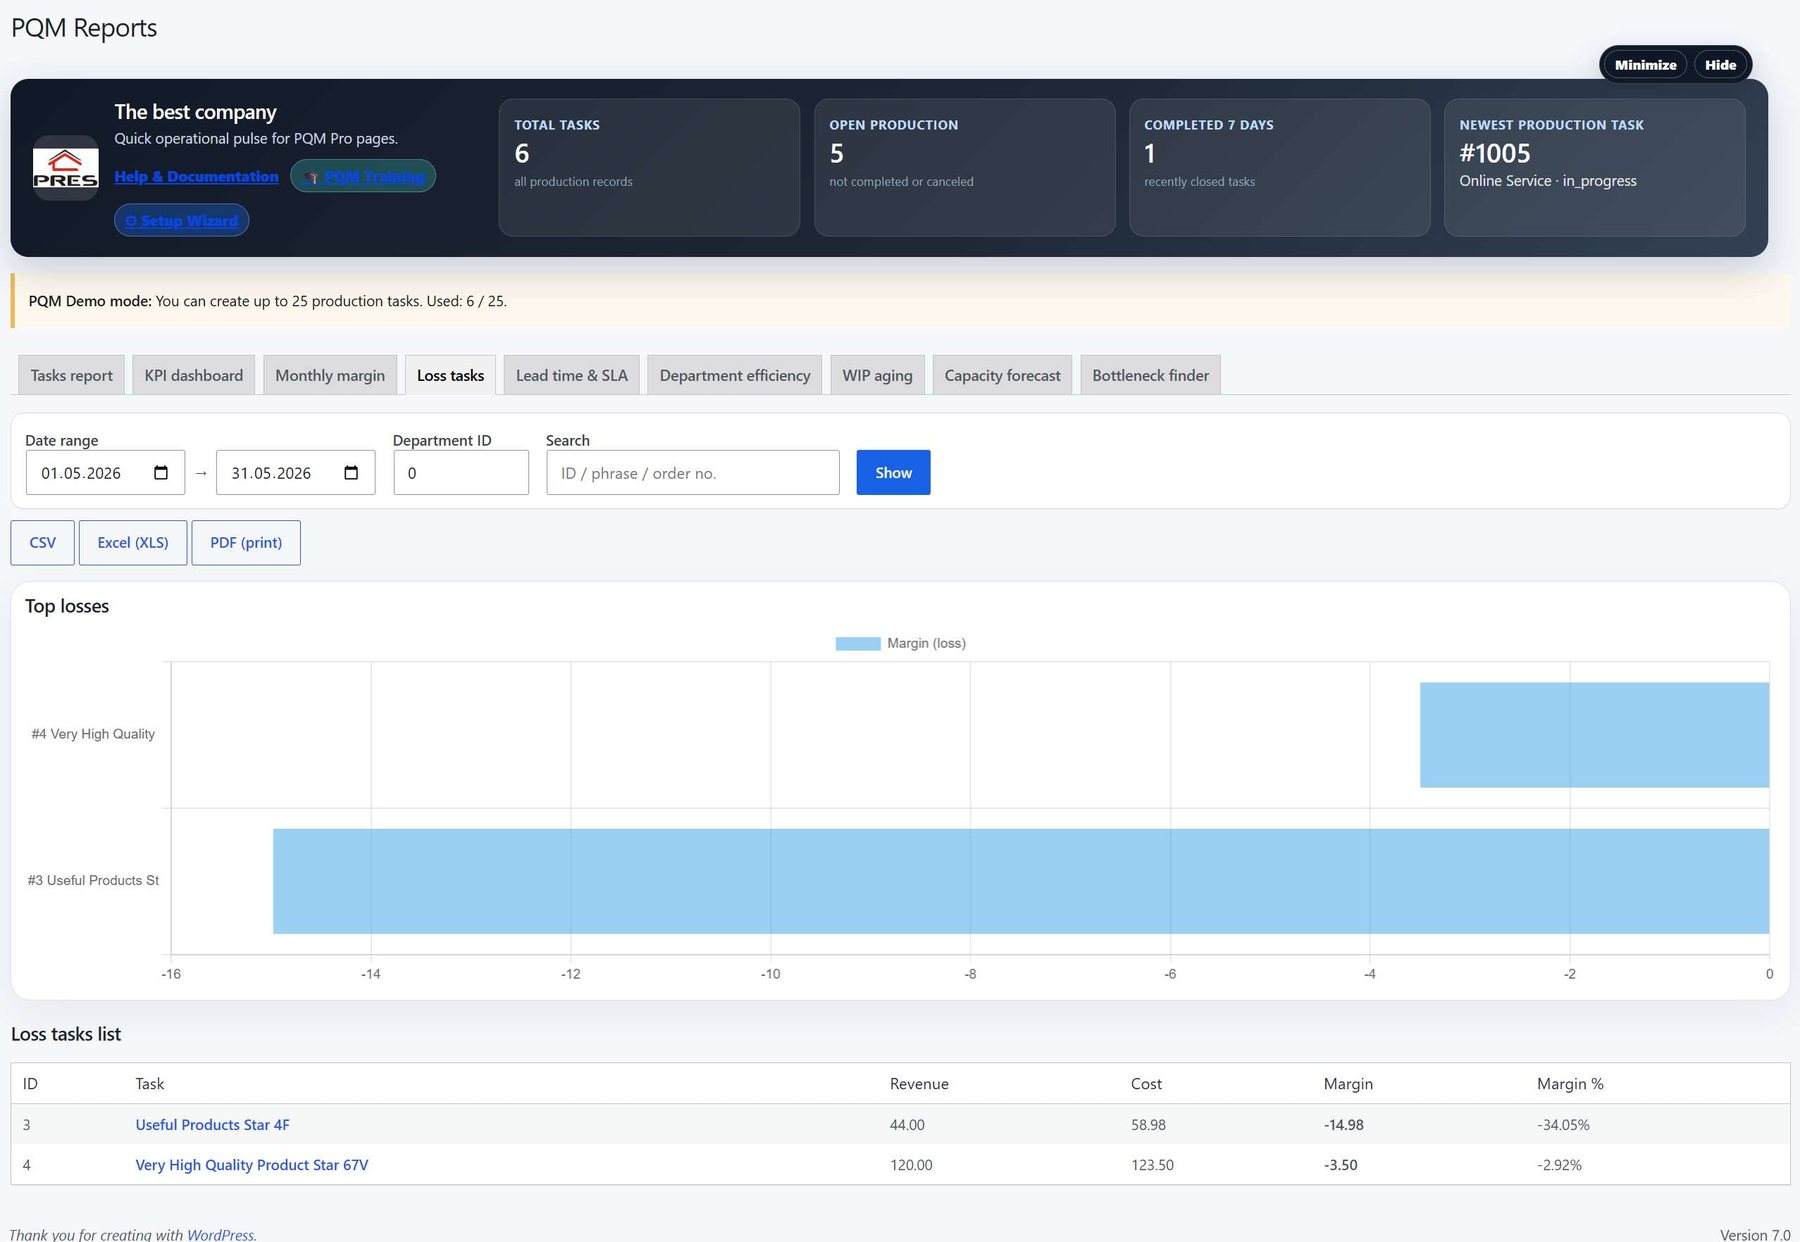
| Loss tasks | Which tasks cost more than they earned? | Revenue and actual_total/cost data. |
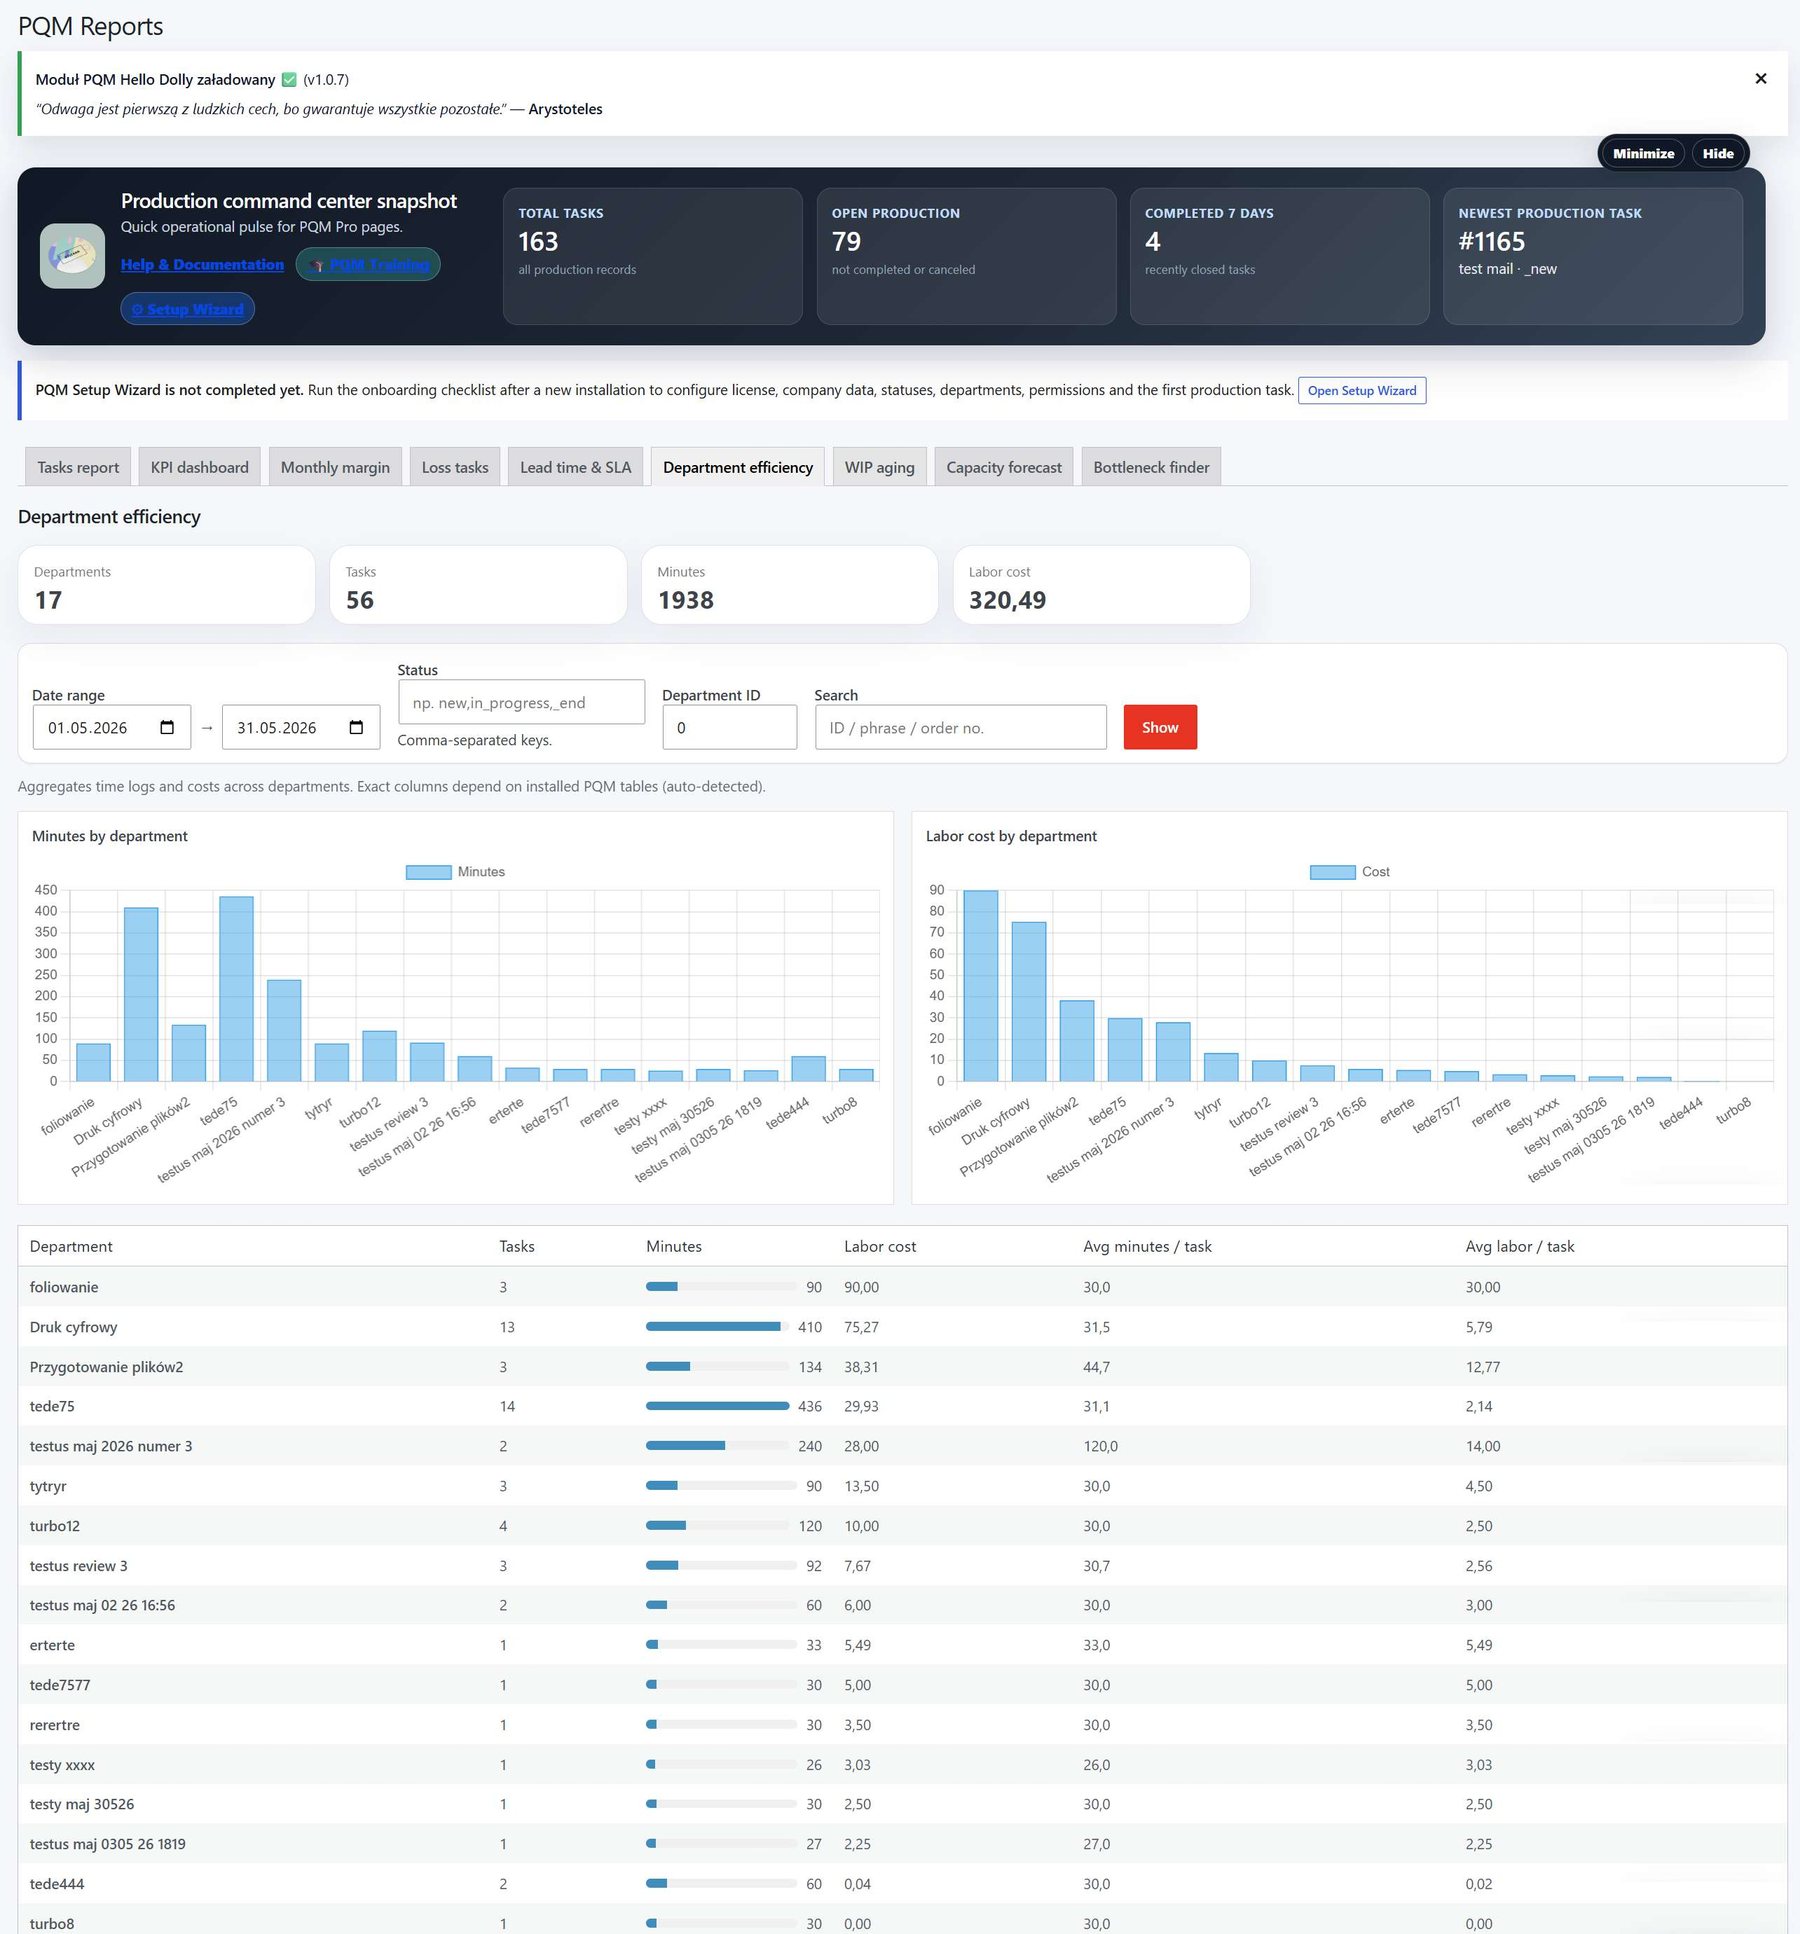
| Department performance | Where are bottlenecks or workload concentration? | Department assignment and task stage history. |
How to read reports step by step
Select the correct date range. A wrong date range is the most common reason for “missing” report data.
Start with task count. Confirm that the total roughly matches what you expect from the task list.
Check status mix. Too many tasks in “New” or “Waiting” may indicate operational problems.
Check completed tasks and on-time percentage only after tasks have both deadline and completion date.
Open loss tasks or margin reports only after revenue and cost data are entered consistently.
When exporting, write the selected date range and filters in your file name so nobody misreads the export later.
Data quality rules
| If this is missing… | The report problem will be… | Fix |
|---|---|---|
| Deadline | On-time KPI cannot be calculated reliably. | Add due date before production starts. |
| Completion date/status | Done/day chart may be empty or wrong. | Use completed/_end status only when job is finished. |
| Department | Department workload/bottleneck report loses meaning. | Assign department for every active task. |
| Order total / revenue | Margin report cannot compare income against cost. | Connect WooCommerce order or enter offline revenue. |
| Actual cost | Loss tasks and margin are meaningless. | Enter labor/material/actual_total values consistently. |
| Cancelled status | Cancelled tasks may distort normal production. | Use proper cancellation status and report exclusions. |
Beginner example
Example: on-time percentage looks very low
Before assuming production is failing, check whether completed tasks have real deadlines and completion dates. If many old tasks were completed late in the system only because somebody updated them after the fact, the KPI may reflect cleanup behavior rather than real production performance.
Exporting reports
Choose report type.
Set date range, status and department filters.
Click refresh/apply if the screen requires it.
Review visible rows and totals.
Export to CSV/XLS/PDF only after verification.
Store exported files in a consistent folder and include date range in the filename.
Good practice
- Do not use reports as punishment. Use them to find bottlenecks and fix the process.
- Review reports weekly at first, then monthly after the workflow is stable.
- Always compare dashboard numbers with task list details when something looks strange.
- Teach managers that clean task data is part of production discipline.
Screenshot reference
How to use screenshots
Click any screenshot to open it in a new tab. This is useful for zooming in while following the step-by-step instructions.
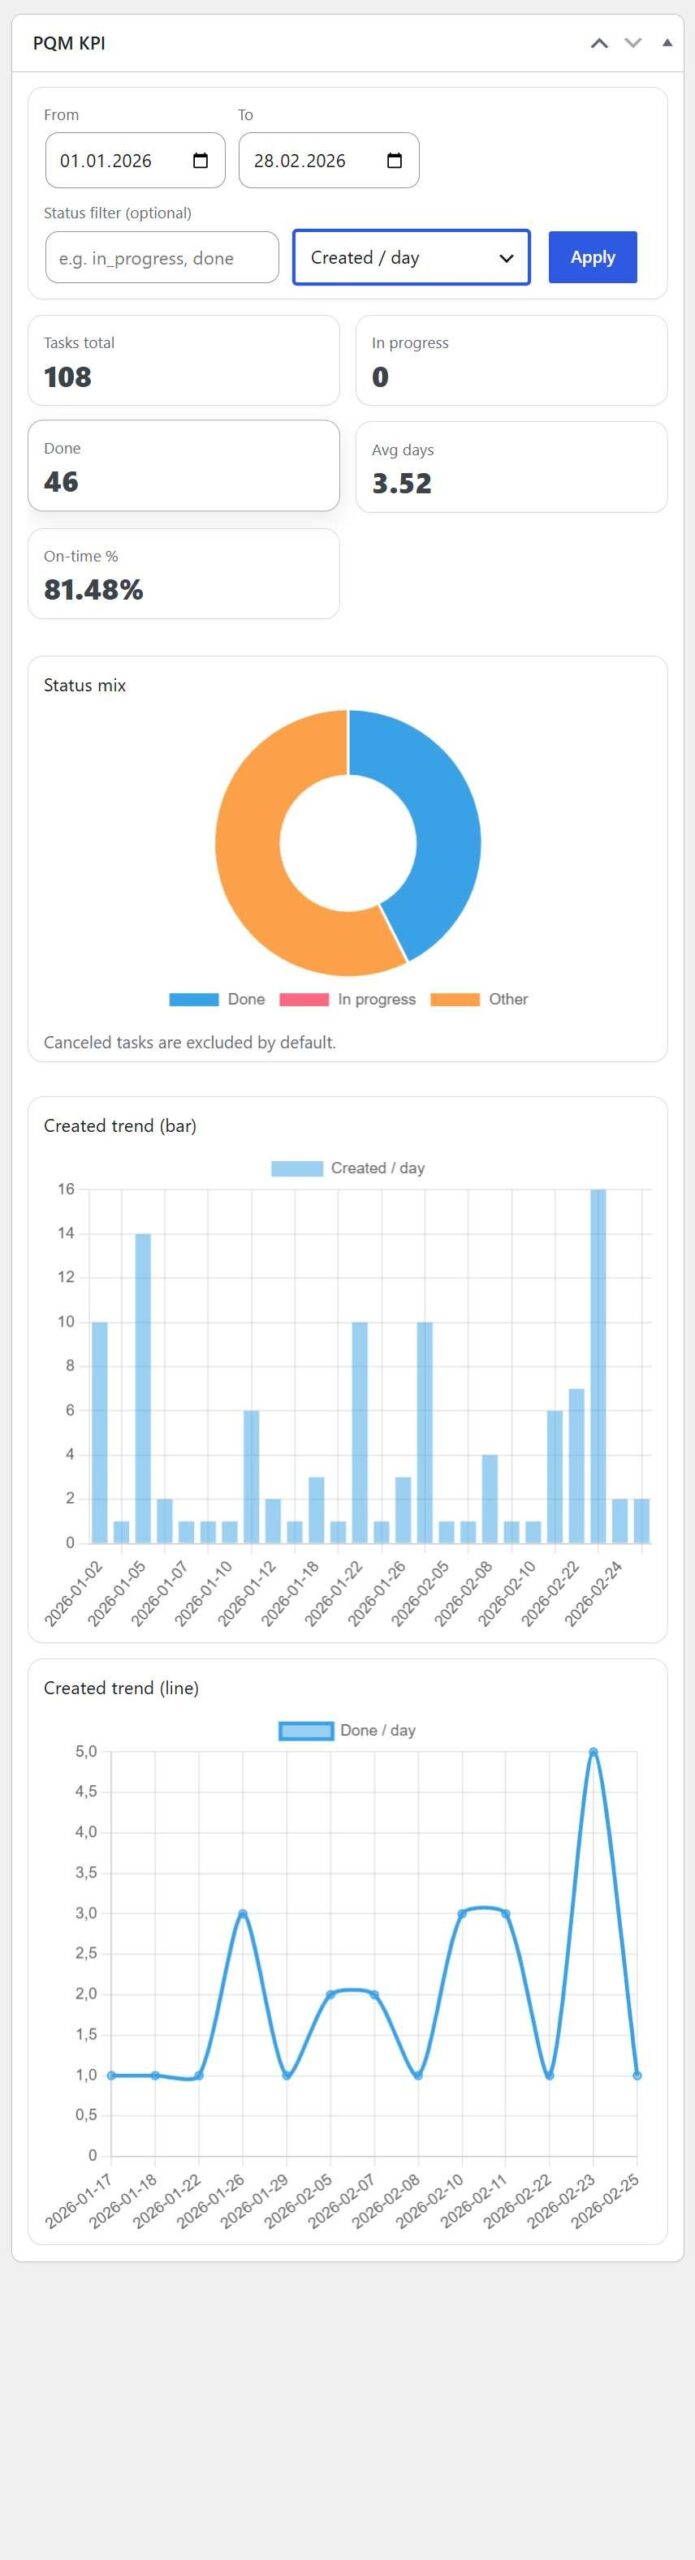
KPI Dashboard
KPI dashboard reference. Use it to explain production indicators, charts and quick health checks.
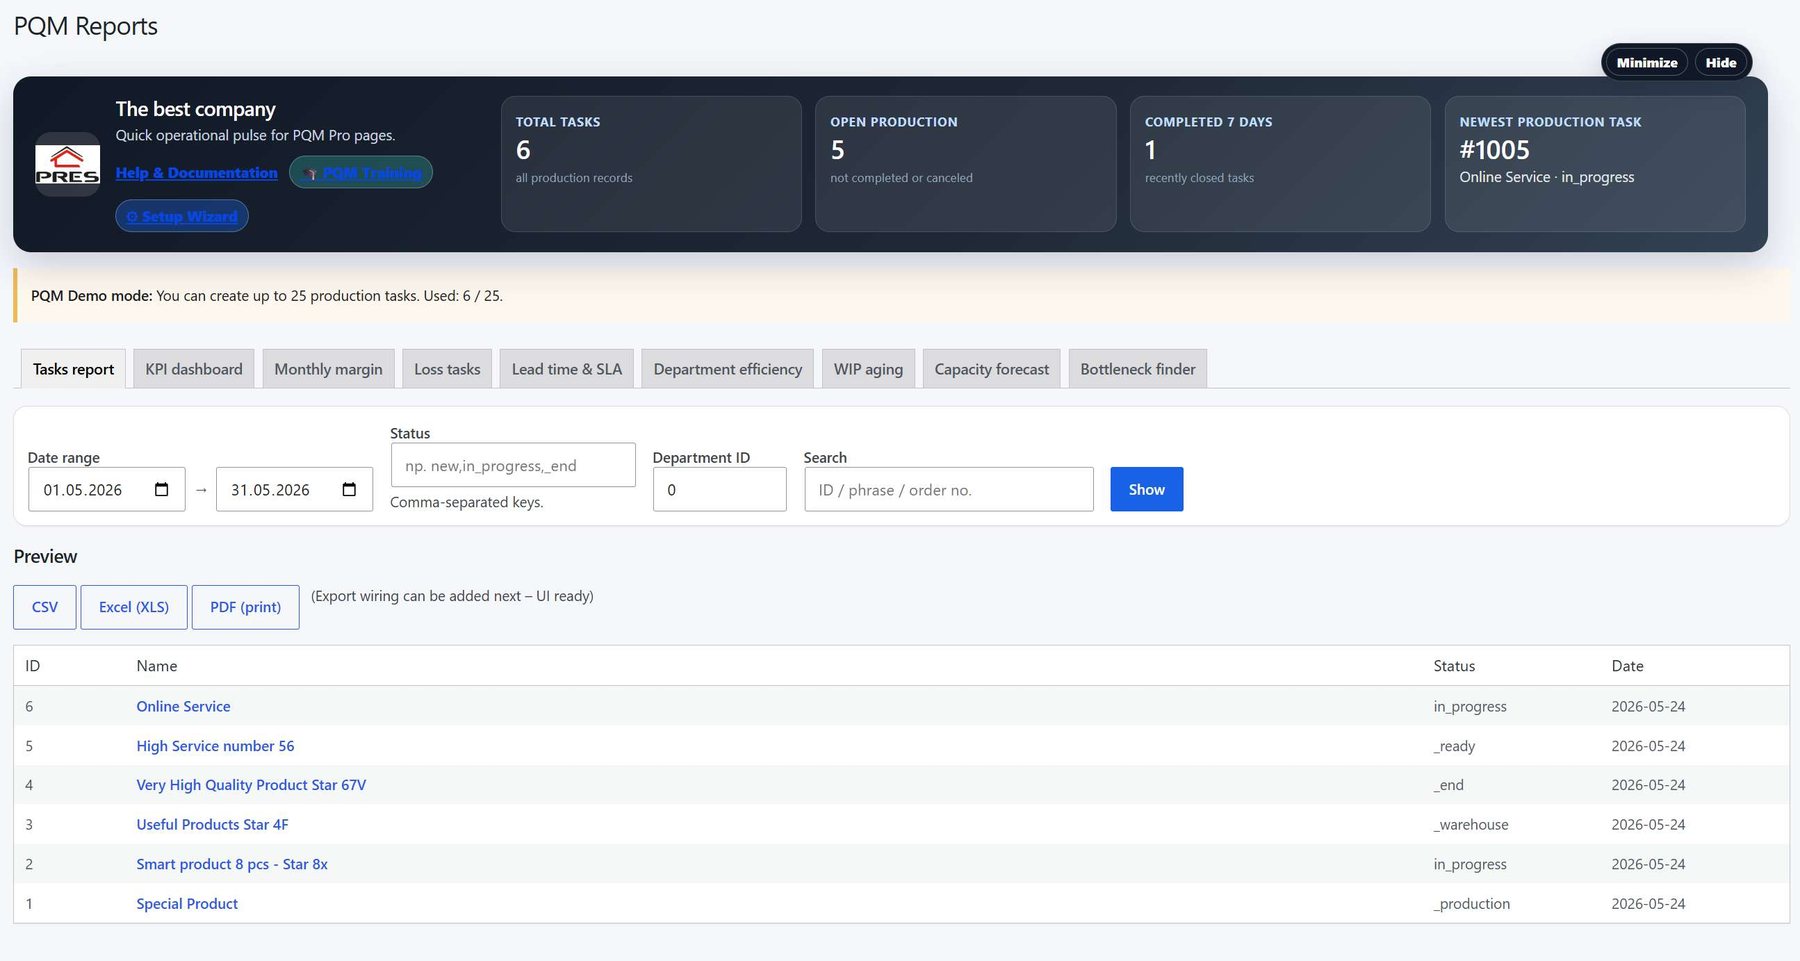
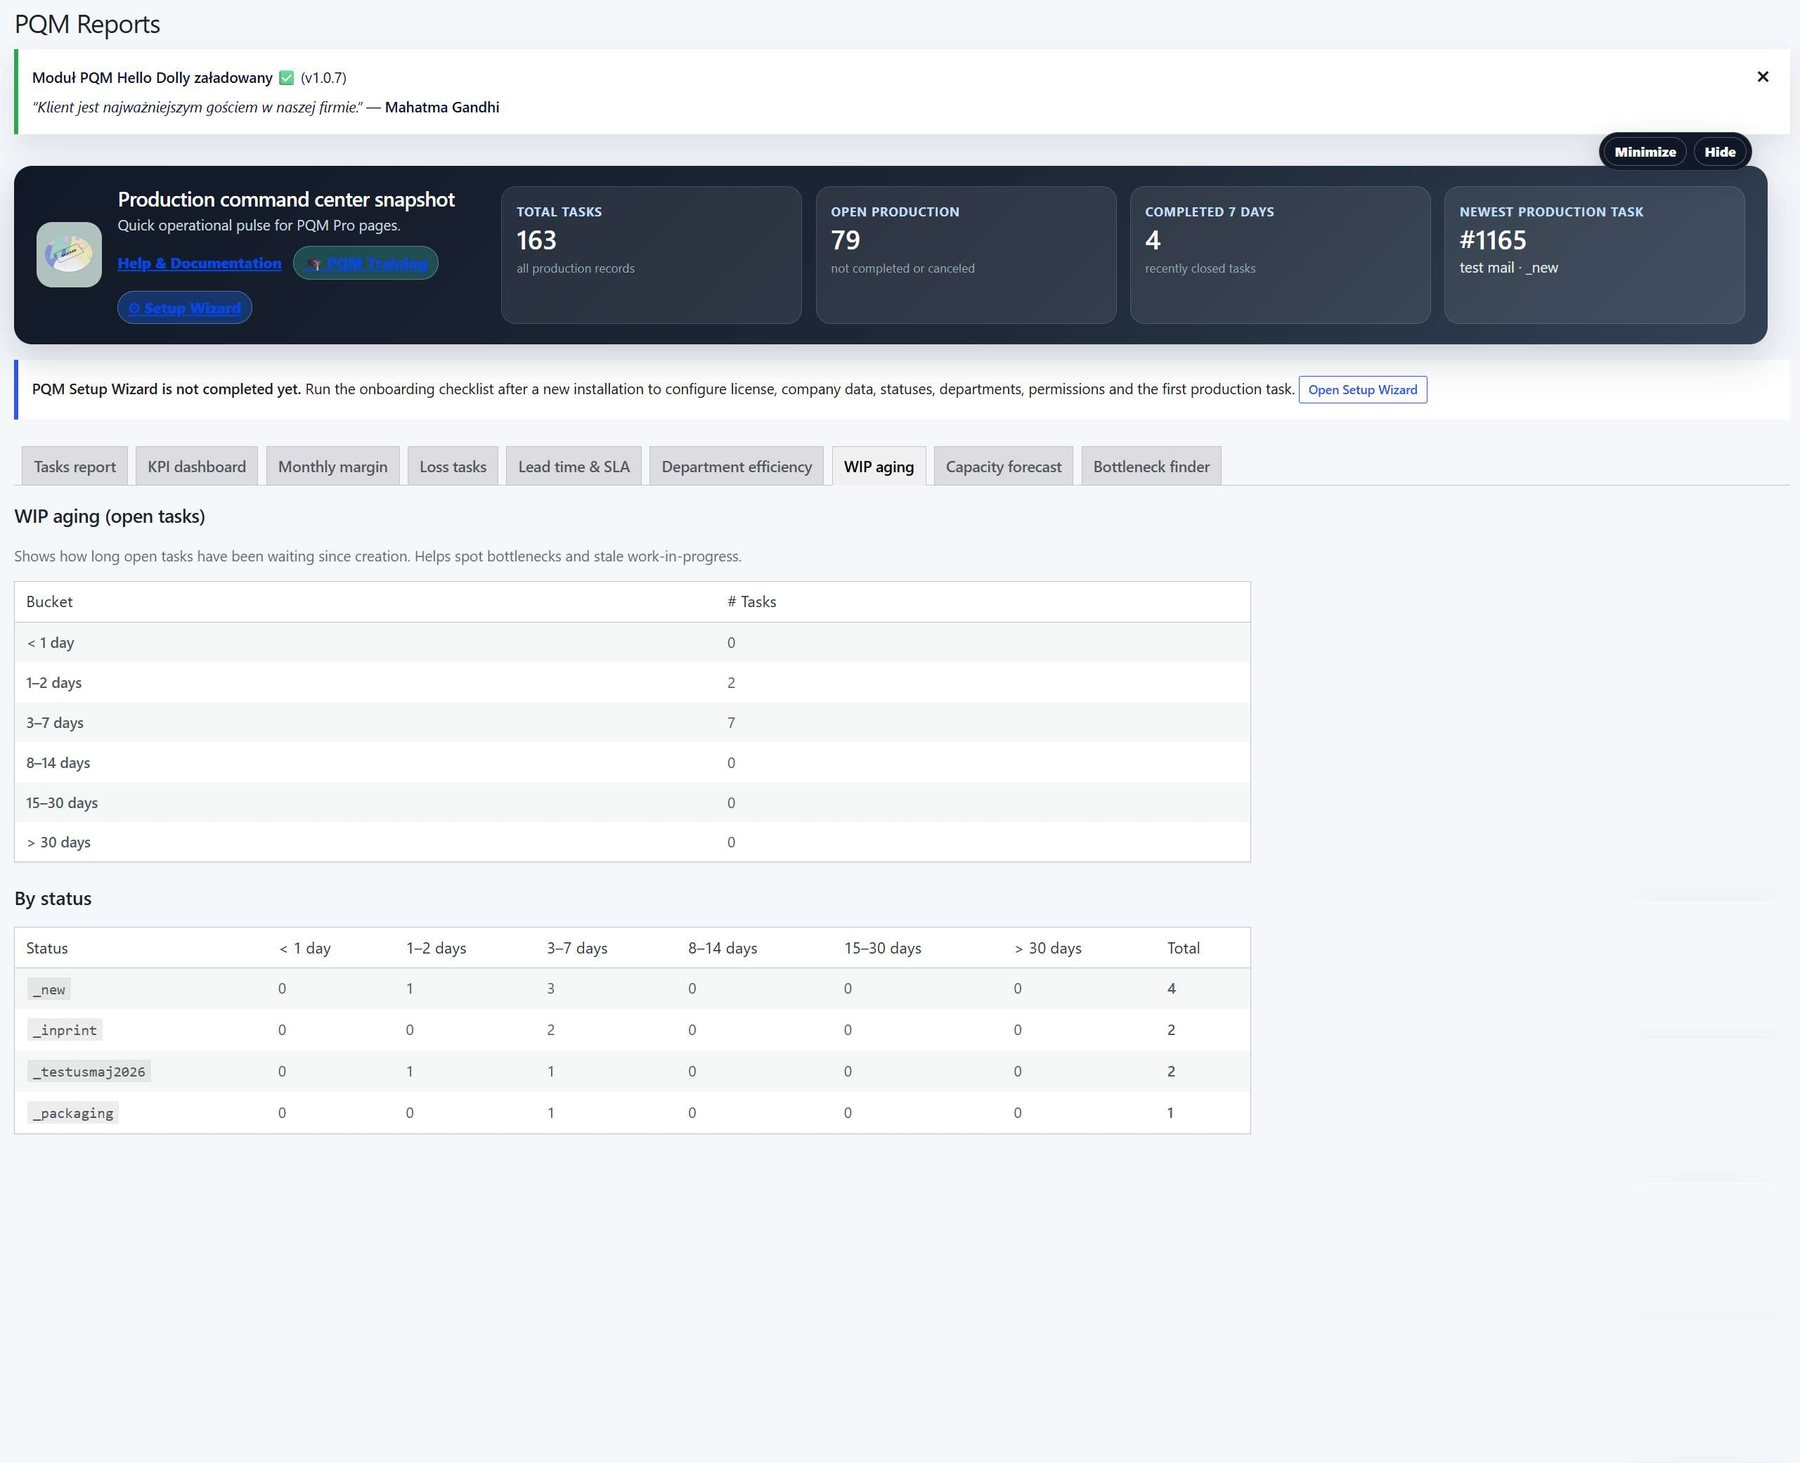
Reports overview 1
Reports reference screen showing one of the available analysis views.
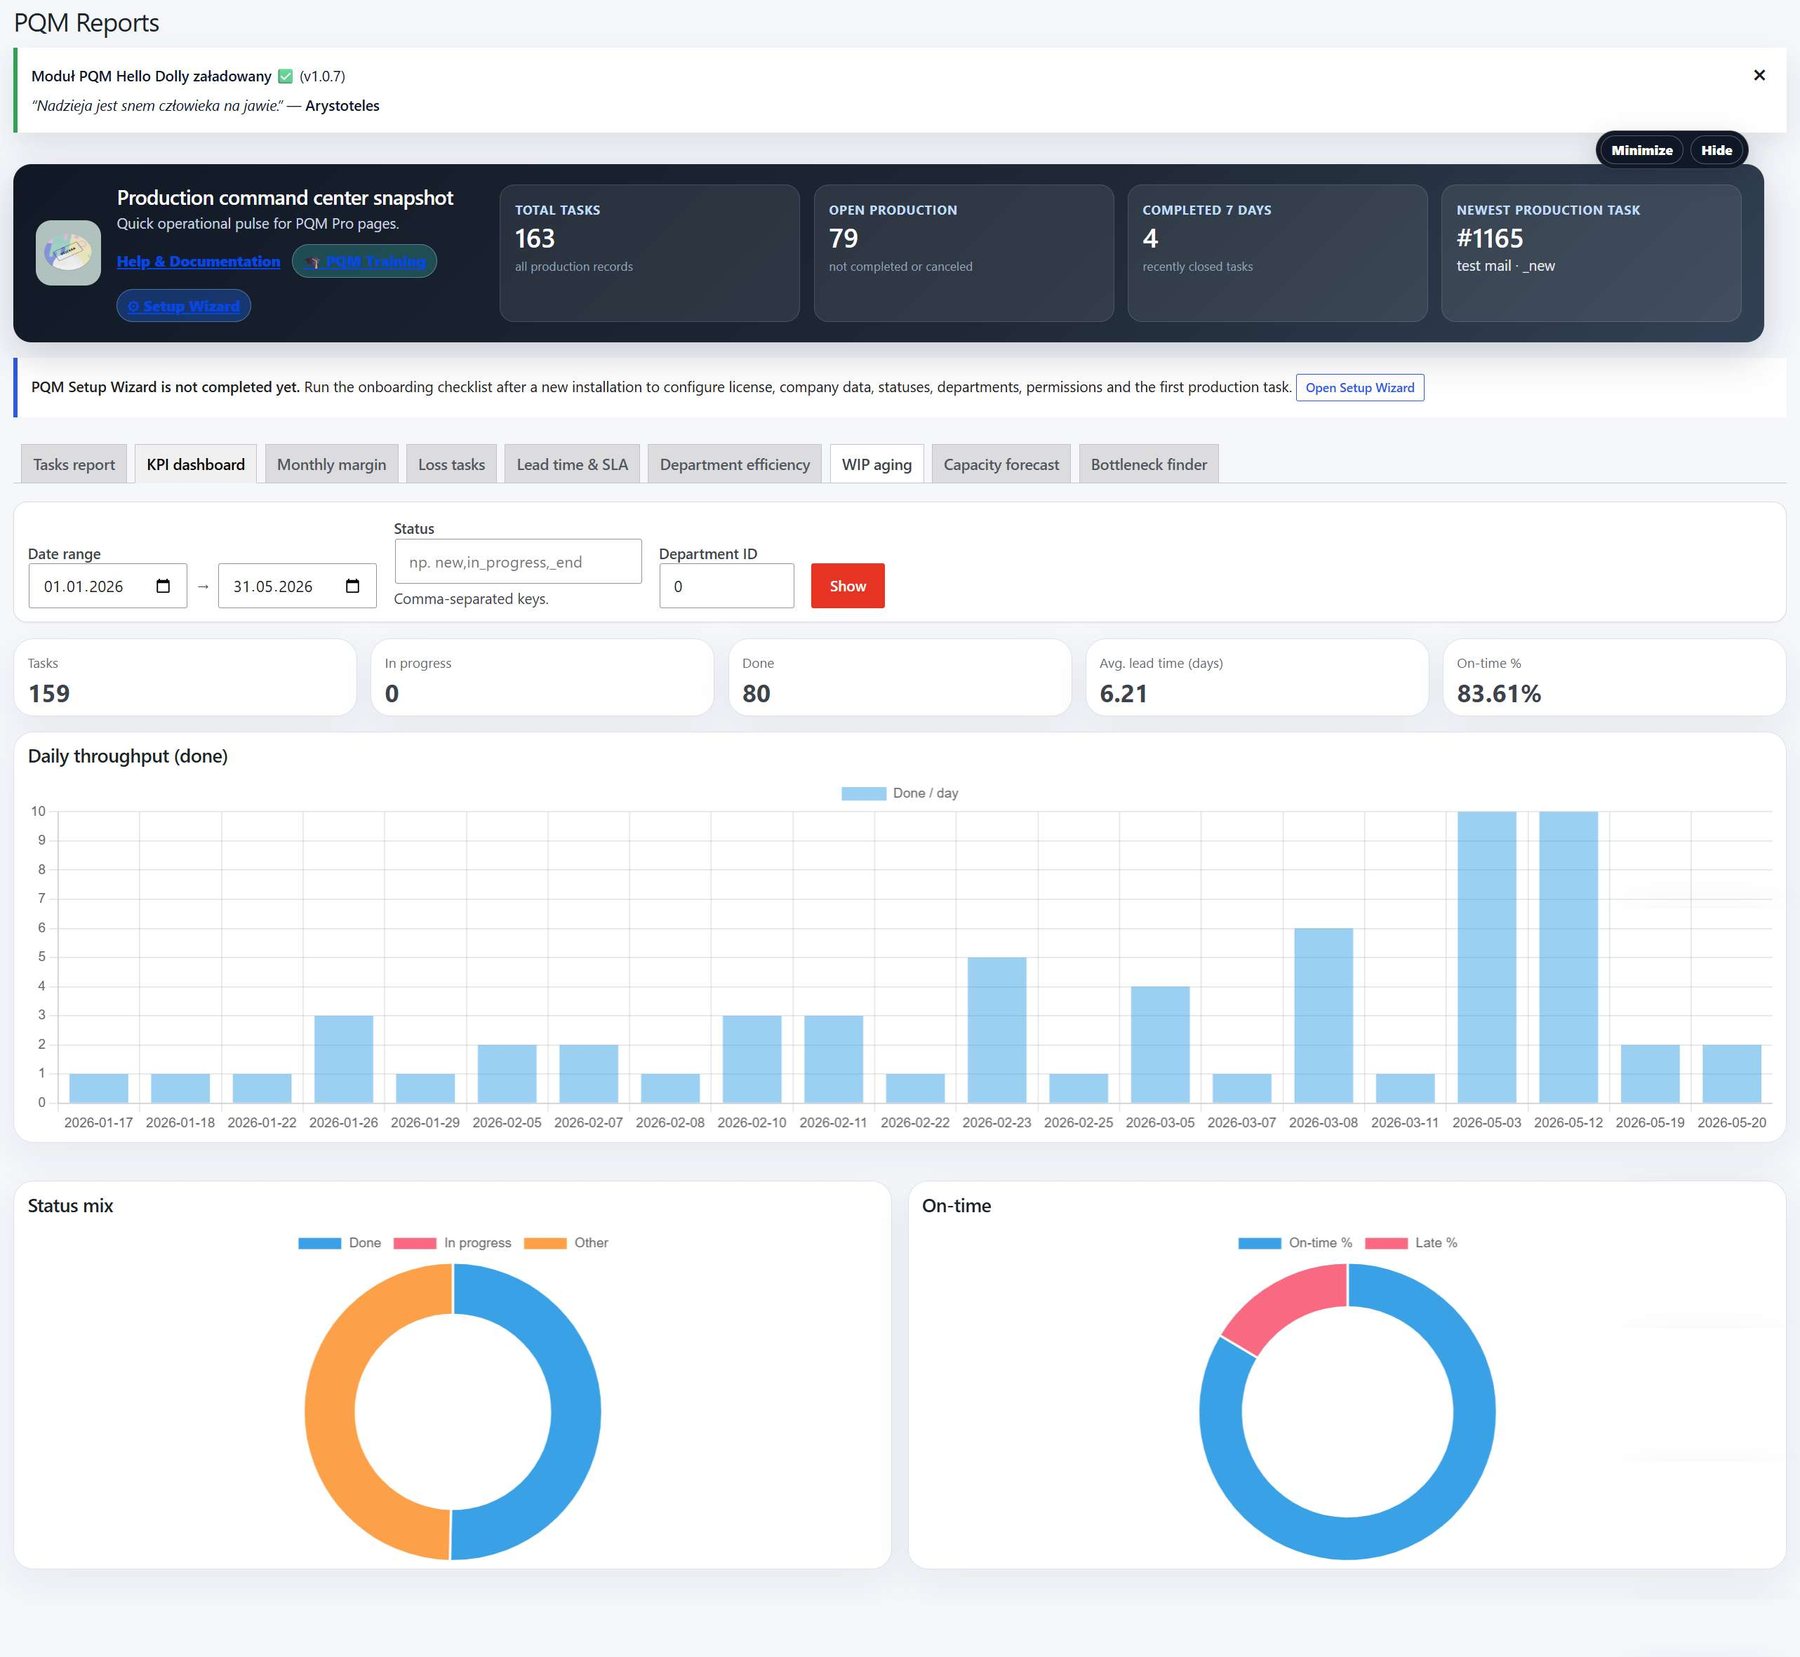
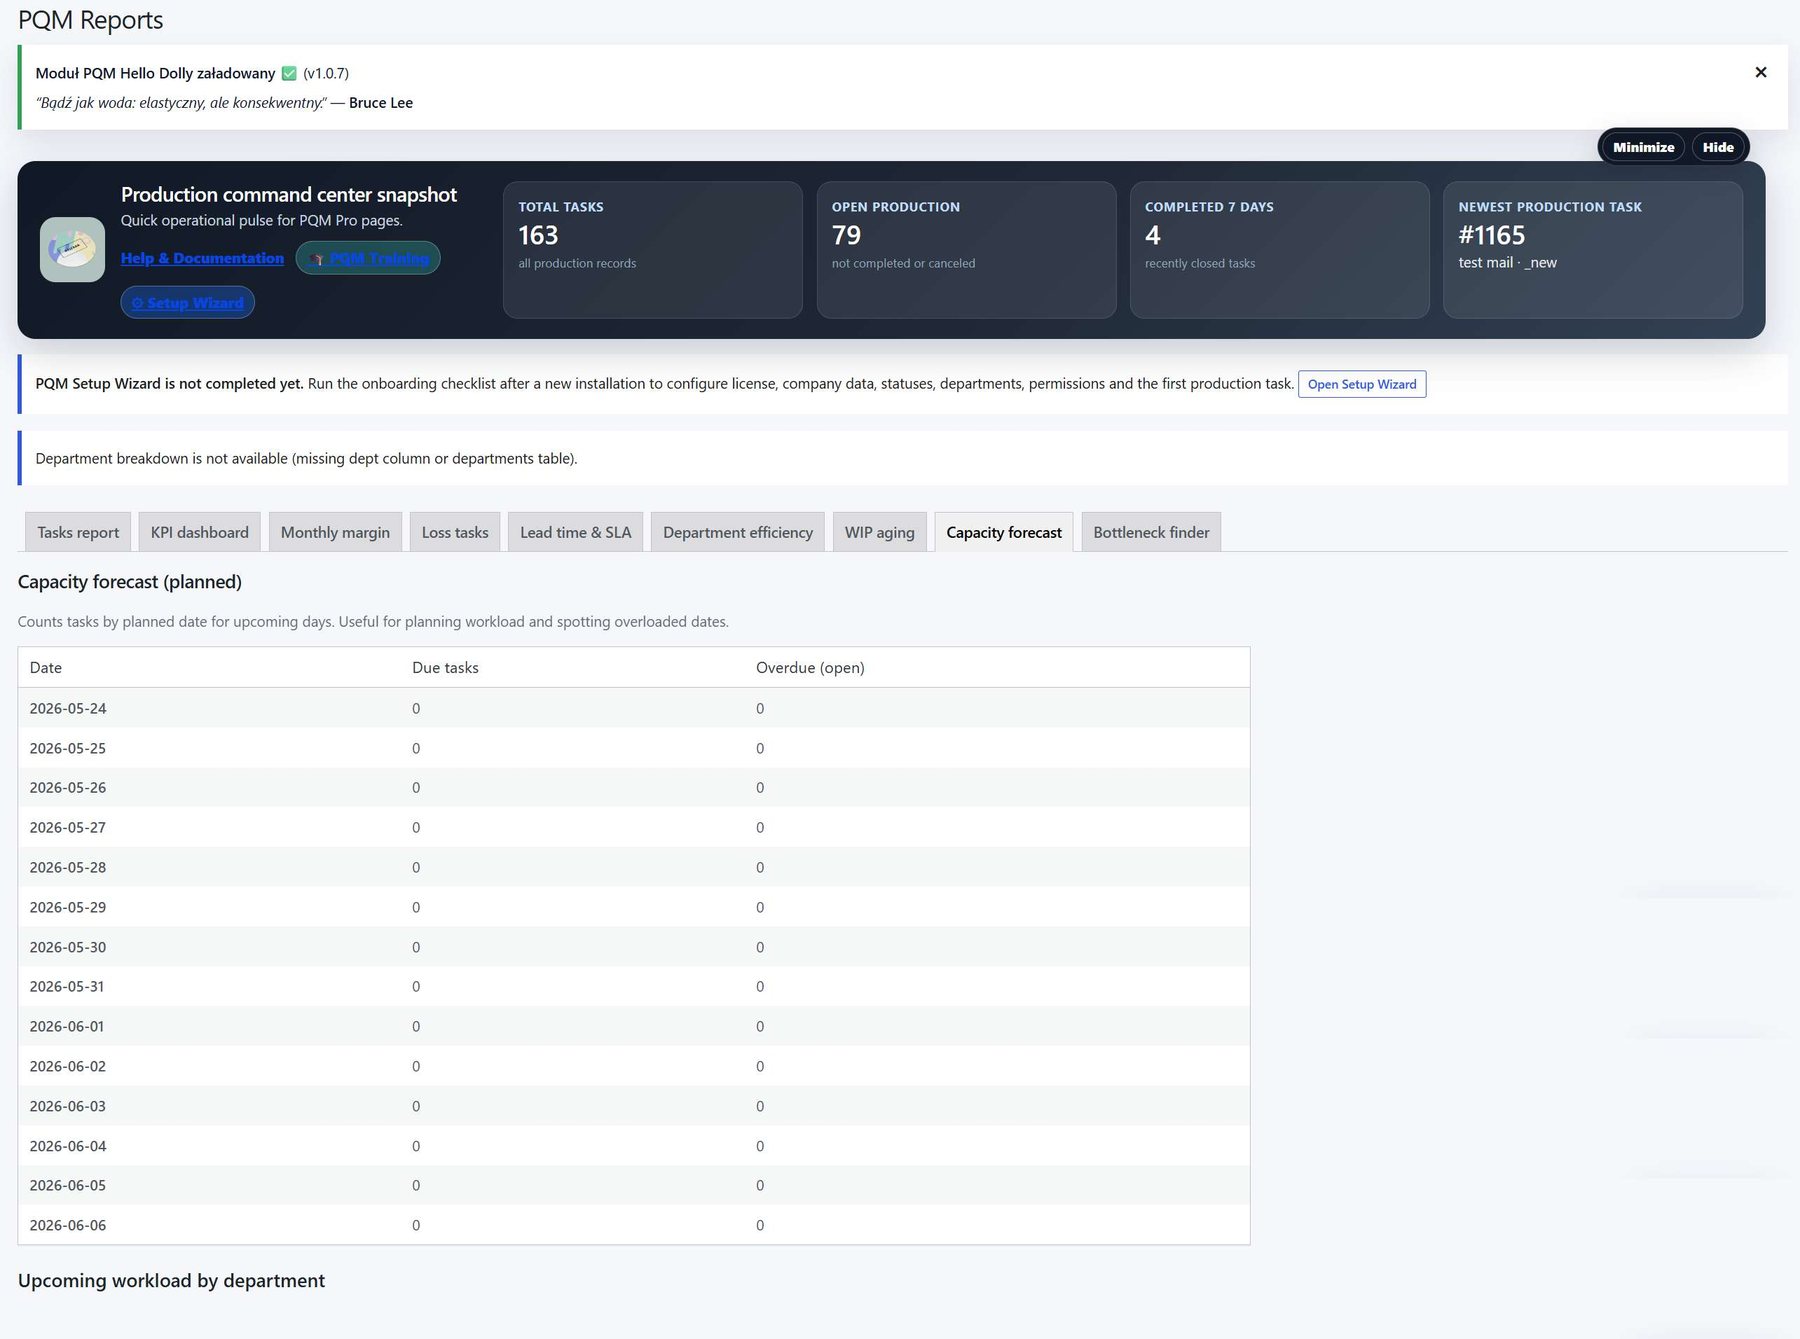
Reports overview 2
Reports reference screen showing another report or KPI view.
Reports overview 3
Reports reference screen showing another report or export-oriented view.
Reports overview 4
Additional reports reference screen.
Reports overview 5
Additional reports reference screen.
Reports overview 6
Additional reports reference screen.
Reports overview 7
Additional reports reference screen.
Reports overview 8
Additional reports reference screen.
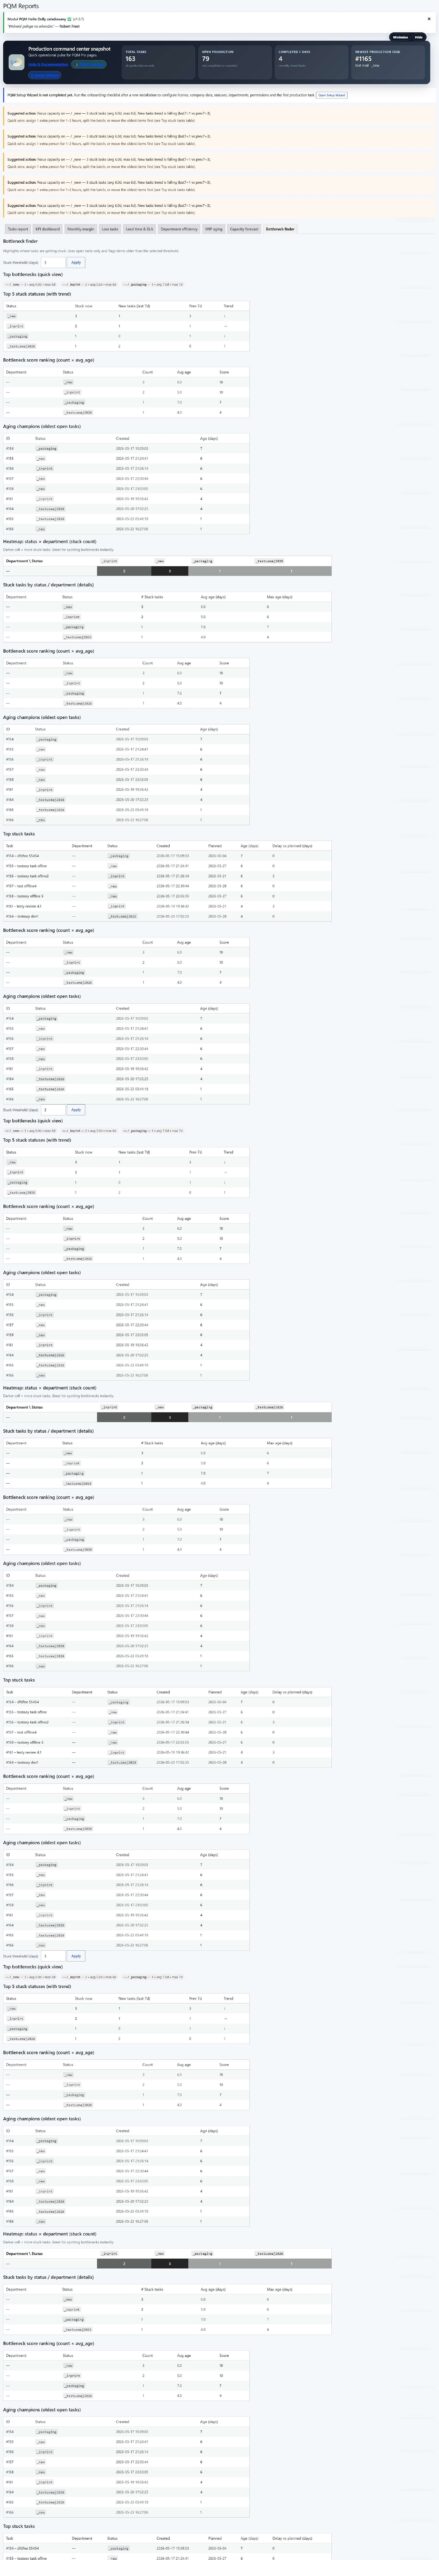
Reports overview 9
Large reports reference screen. Open the image if you need to zoom into details.
Who should use this screen?
AdministratorConfigures PQM, licenses, modules, health checks, capabilities and technical maintenance. This role should be limited to trusted users.
Manager / Shop ManagerControls daily production, creates tasks, checks reports, follows deadlines and supervises employee work without changing technical settings.
Production EmployeeWorks mainly in the frontend Employee Portal and updates assigned production stages without using the WordPress admin area.
Troubleshooting for beginners
| Symptom | Simple explanation | What to check first |
|---|---|---|
| The page looks empty | The system may have no demo data yet, or the current user may not have access to the required role/capability. | Create one test task, assign a department, then refresh the screen. Also check the user role. |
| A button opens a login page or My Account | The visitor is not logged in or the page is using a frontend-safe route that requires authentication. | Log in with a test user that has the expected role. Check whether the shortcode/page is visible only to logged-in users. |
| Data exists but does not appear in a report/chart | Filters, date range, status rules or completion dates may exclude the task. | Clear filters, expand the date range and verify that the task has the status/date required by the report. |
| Something changed but the screen still shows old data | Browser cache, WordPress cache or AJAX response cache may show old information. | Refresh the page, clear cache for this page and test in an incognito window before debugging code. |
| The layout is broken on a small screen | Wide tables and timelines need horizontal space; this is normal if the content remains readable. | Use the mobile breakpoint, keep cards in one column and allow horizontal scroll only inside tables/timelines. |
Readiness checklist
A beginner can explain what this screen is for after reading the first two sections.
The correct role can open the screen and restricted roles cannot see unsafe actions.
There is at least one realistic test task visible in the screen.
Buttons and links go to the expected place.
The empty state explains what to do next instead of looking broken.
The page remains readable on tablet and mobile.
Related training pages
Training HomeTraining overview and recommended learning path.Production DashboardDaily command center, active tasks, metrics and quick actions.Core ConfigurationSystem settings, statuses, roles, capabilities and safe defaults.Tasks and Add TaskHow to create, read and update production tasks step by step.Departments and WorkflowHow production stages and responsibilities are modeled.Calendar and Standard GanttDate planning, deadlines and visual timeline overview.Email Queue and CommunicationCustomer messages, email queue and communication templates.Modules / MarketplaceOptional modules, activation state and upgrade path.